Prokaryotic Genome Weight
Calculation of prokaryotic genome weight and the negligible influence of genome GC%
Introduction
In a previous blogpost, I explored prokaryotic genome size (i.e. the length of a prokaryotic genome in number of nucleotides). In this blogpost, I will take the previously determined genome sizes and multiply them against the molecular weight of a DNA base pair to arrive at the mass of a prokaryotic genome. I start by examining the structural components of DNA (the 4 nitrogenous bases, a pentose sugar called deoxyribose, and phosphate) and their elemental composition, and then I will determine the amount of mass variation that could result from natural variation in genome GC content.
Load Packages
Let’s load the packages that we’ll use in this blogpost up front so that we don’t have to search the code snippets in order to find the dependencies. There are 2 packages that we’ll use:
- Tidyverse for importing data into a Tibble object
- PeriodicTable, which includes a function for retrieving the atomic masses of the elements
library(tidyverse)## ── Attaching packages ───────────────────────────────────────────────────────────────────────────────────────────────────────── tidyverse 1.3.0 ──## ✔ ggplot2 3.2.1 ✔ purrr 0.3.3
## ✔ tibble 2.1.3 ✔ dplyr 0.8.3
## ✔ tidyr 1.0.0 ✔ stringr 1.4.0
## ✔ readr 1.3.1 ✔ forcats 0.4.0## ── Conflicts ──────────────────────────────────────────────────────────────────────────────────────────────────────────── tidyverse_conflicts() ──
## ✖ dplyr::filter() masks stats::filter()
## ✖ dplyr::lag() masks stats::lag()library(PeriodicTable)Determining the Number of Atoms of Each Element in a DNA Base Pair
DNA is a macromolecule that consists of a sequence of chemically linked nucleotides. Nucleotides are comprised of a nucleoside linked to a phosphate. Nucleosides consist of a nitrogenous base such as a purine (A or G) or a pyrimidine (T or C) linked to a sugar, which in the case of DNA is the pentose sugar deoxyribose. Hence, there are 3 components of DNA:
- Phosphate
- Pentose sugar deoxyribose
- Nitrogenous bases Adenine, Thymine, Cytosine, and Guanine
Whereas each nucleotide in DNA contains phosphate and deoxyribose, the nitrogenous base will vary. Indeed, it this variation in the sequence of nitrogenous bases along the length of a genome that determines the information content of the macromolecule and ultimately the identity of the organism.
Let’s take a closer look at the 3 components of DNA by examining their molecular structure, determining the number of atoms of each element in their structure, and then calculating their molecular mass.
The Phosphate
Phosphate is the simplest of the 3 DNA components, consting of 1 phosphorus atom and 4 oxygen atoms:
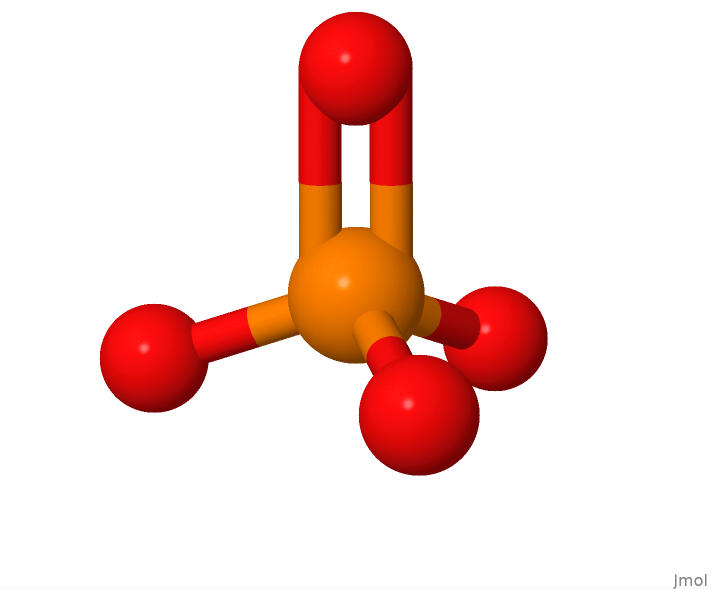
The structure of a lone phosphate molecule.
This view of a phosphate molecule was generated using Jmol from an sdf format file representing the structure of PO4. The sdf file was downloaded from the RCSB Protein Databank webpage for PO4.
The colors in the molecular structures presented in this blogpost correspond to the CPK (Corey, Pauling, Koltun) color scheme:
carbon is grey
hydrogen is white
oxygen is red
nitrogen is blue
phosphorus is orange
The Pentose Sugar Deoxyribose
The pentose sugar deoxyribose, along with phosphate, form the backbone of DNA by linking the nucleotides. In DNA, deoxyribose forms a furanose ring as in this view of the structure of beta-D-2-Deoxyribose:
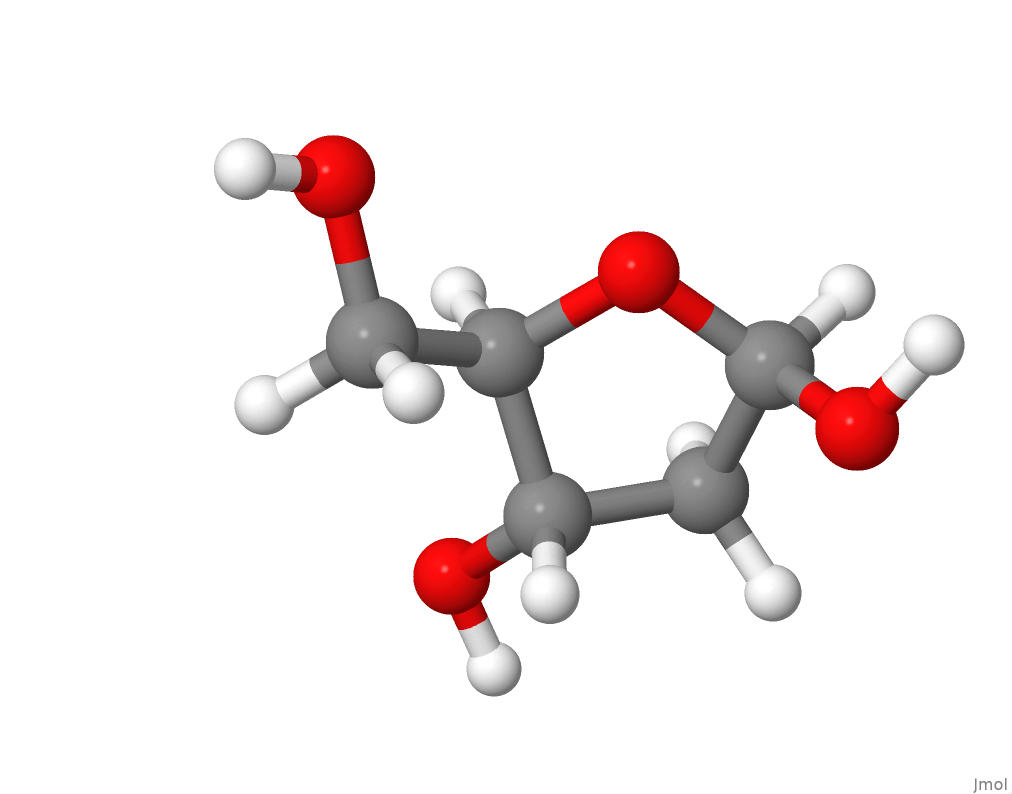 .
.
I downloaded the sdf format file for the chemical structure of beta-D-2-Deoxyribose from PubChem in order to produce the above molecular structure image within Jmol.
The chemical formula for beta-D-2-Deoxyribose at PubChem is C5H10O4.
I will now calculate the molecular mass of beta-D-2-Deoxyribose. For reference, these are the atomic masses of the elements in DNA:
| Element | Atomic Mass |
|---|---|
| C | 12.0107 |
| O | 15.9994 |
| N | 14.0067 |
| P | 30.9738 |
| H | 1.0079 |
The mass of each element is conveniently accessible via the mass() function in the R package PeriodicTable.
# Create the data frame based on the formula for deoxyribose.
deoxyribose.df1<- data.frame(element = c("C","H","O"), freq = c(5,10,4))

# Add a 3rd column that is the atomic mass of each element.
deoxyribose.df2 <- cbind(deoxyribose.df1, MW = PeriodicTable::mass(deoxyribose.df1[1:nrow(deoxyribose.df1),1]))

# Add a 4th column that is the total molecular weight of each element
# in the deoxyribose molecule. This is the product of the atomic
# mass and the number of atoms of each element.
deoxyribose.df3 <- cbind(deoxyribose.df2, MW.tot = deoxyribose.df2[,2] * deoxyribose.df2[,3])

deoxyribose.df3
## element freq MW MW.tot
## 1 C 5 12.01070 60.0535
## 2 H 10 1.00794 10.0794
## 3 O 4 15.99940 63.9976sum(deoxyribose.df3[,"MW.tot"])## [1] 134.1305The molecular weight of deoxyribose is determined to be 134.1305 g/mol, which matches the molecular weight for beta-D-2-Deoxyribose at PubChem.
The Nitrogenous Bases
I’ll obtain the number of C, N, O, and H atoms in each nitrogenous base by using a column from the Protein Data Bank (PDB) files for the molecular model of each base. The PDB files for each nitrogenous base were obtained from the “required case study files” for an online DNA case study written by Leonardo Trabuco and Elizabeth Villa.
Adenine
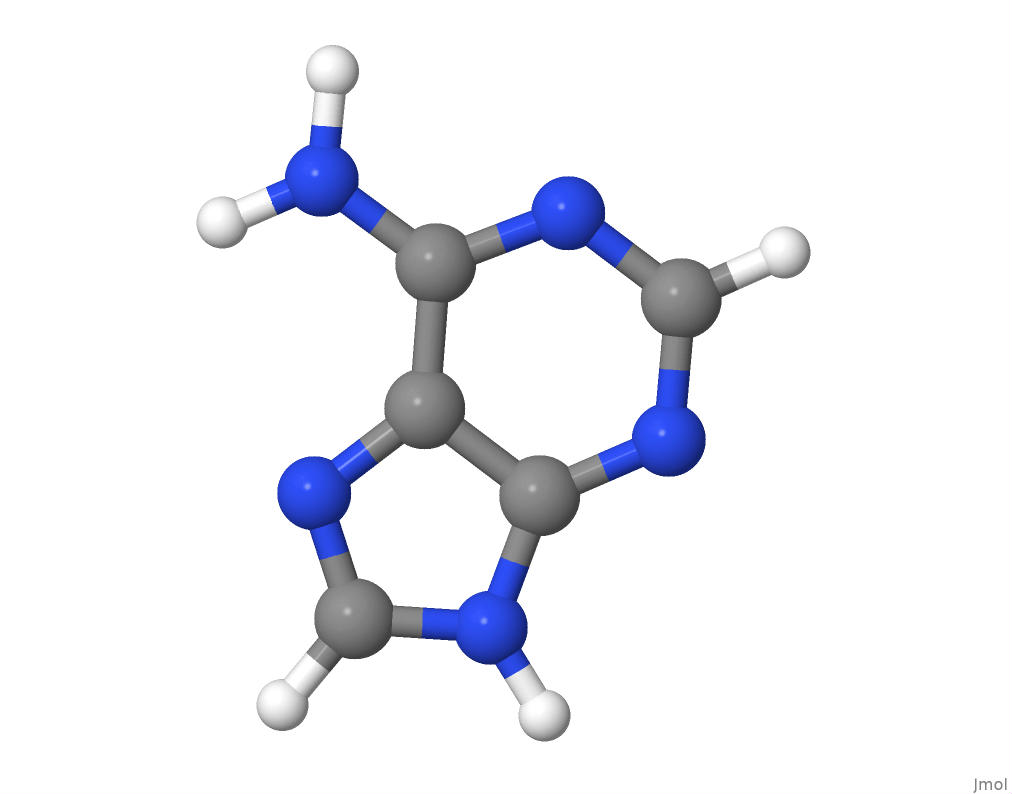
The molecular structure of adenine.
I will obtain the number of atoms of each element in the adenine structure by parsing its PDB file.
# Read the adenine PDB file into a tibble, skipping the first row
# that causes the column of interest to be missed.
adenine <- read_table2(file = "../../static/files/adenine.pdb",
                       col_names = FALSE,
                       skip = 1)

# Remove the last row that only contains "end".
A.atoms <- adenine[seq(1,(nrow(adenine)-1)),12]

# Make a table with the total number of atoms of each type.
A.table <- table(A.atoms)
A.table
## A.atoms
## C H N
## 5 5 5The results corroborate with the C5N5H5 chemical formula for adenine on PubChem.
Next, I will calculate the total molar mass of the adenine molecule. To do this, I will need the atomic mass of each element:
# Change to a data frame.
A.df <- as.data.frame(A.table)

# Add a 3rd column that is the atomic mass of each element.
A.df2 <- cbind(A.df, MW = PeriodicTable::mass(A.df[1:nrow(A.df),1]))

# Add a 4th column that is the total molecular weight of each element
# in the nucleotide base molecule. This is the product of the atomic
# mass and the number of atoms of each element.
A.df3 <- cbind(A.df2, MW.tot = A.df2[,2] * A.df2[,3])

A.df3
## A.atoms Freq MW MW.tot
## 1 C 5 12.01070 60.0535
## 2 H 5 1.00794 5.0397
## 3 N 5 14.00670 70.0335sum(A.df3[,"MW.tot"])## [1] 135.1267Hence, the molar mass of adenine is determined to be 135.1267 g/mol, which corroborates with the molar mass of 135.13 g/mol listed for adenine on PubChem.
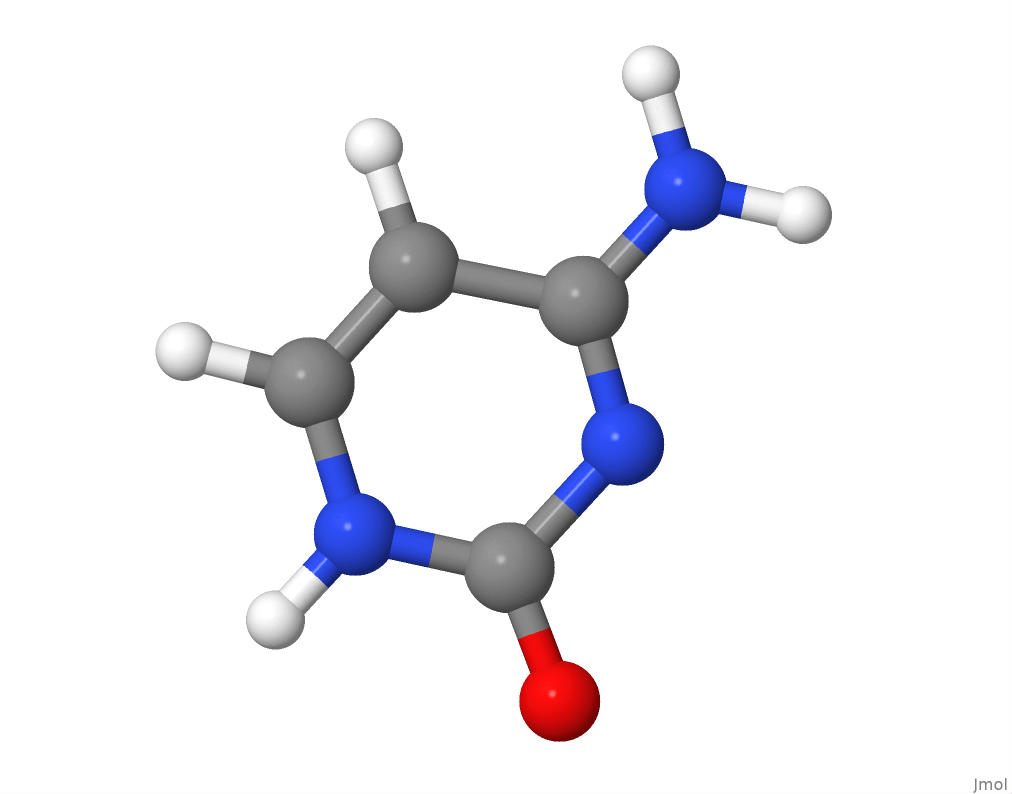
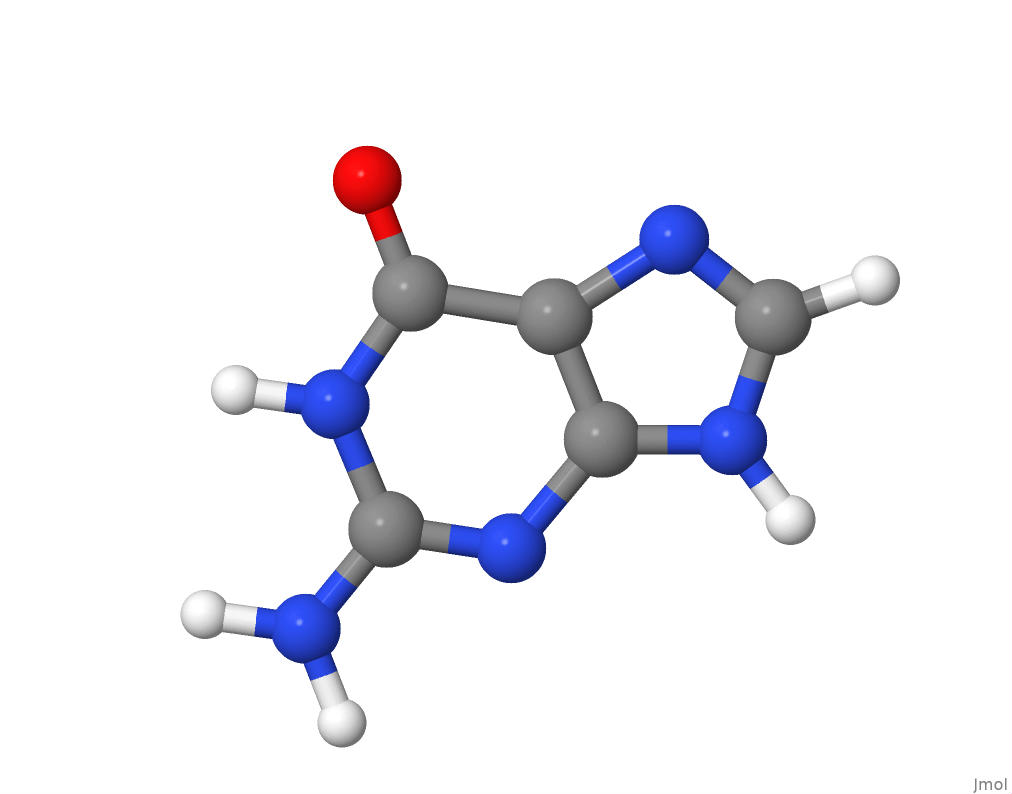
Thymine, Cytosine, and Guanine
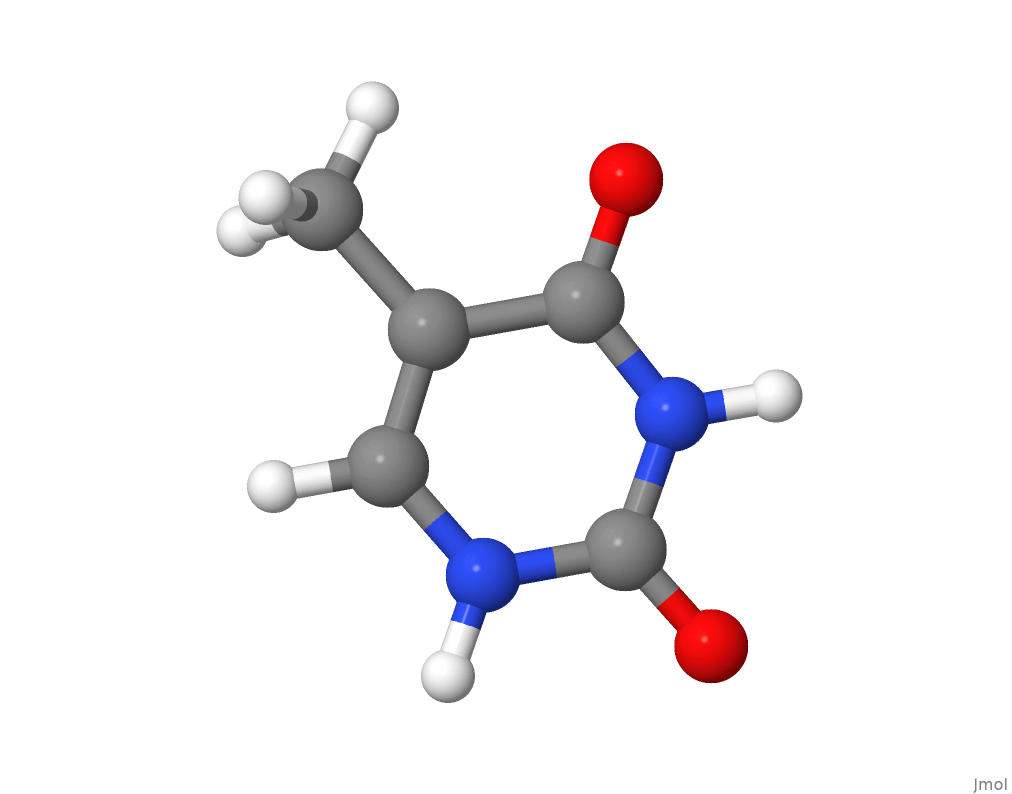
The molecular structure of thymine.
The molecular structure of cytosine.
The molecular structure of guanine.
I will now adapt the previous code for determining the molar mass of adenine into a custom function named nucMolarMass, which takes as input the PDB file, extracts the column that lists each atom in the molecule, and sums the mass of all atoms to obtain the overall molar mass for the nitrogenous base.
nucMolarMass <- function(filename)
{

# Read the adenine PDB file into a tibble, skipping the first row
# that causes the column of interest to be missed.
 nuc <- read_table2(file = paste0("./static/files/",filename),
                       col_names = FALSE,
                       skip = 1)

# Remove the last row that only contains "end".
nuc.atoms <- nuc[seq(1,(nrow(nuc)-1)),12]

# Make a table with the total number of atoms of each type.
nuc.table <- table(nuc.atoms)

# Change to a data frame.
nuc.df <- as.data.frame(nuc.table)

# Add a 3rd column that is the atomic mass of each element.
nuc.df2 <- cbind(nuc.df, MW = PeriodicTable::mass(nuc.df[1:nrow(nuc.df),1]))

# Add a 4th column that is the total molecular weight of each element
# in the nucleotide base molecule. This is the product of the atomic
# mass and the number of atoms of each element.
nuc.df3 <- cbind(nuc.df2, MW.tot = nuc.df2[,2] * nuc.df2[,3])

sum(nuc.df3[,"MW.tot"])

}

# Set the working directory to prevent issues with file input.
setwd("/home/chrisgaby/github/My_Website/")

# Print the adenine molar mass.
T.MM <- nucMolarMass("thymine.pdb")
print(paste("The molar mass for thymine is", T.MM))
## [1] "The molar mass for thymine is 126.11334"# Print the guanine molar mass.
G.MM <- nucMolarMass("guanine.pdb")
print(paste("The molar mass for guanine is", G.MM))## [1] "The molar mass for guanine is 151.1261"# Print the cytosine molar mass.
C.MM <- nucMolarMass("cytosine.pdb")
print(paste("The molar mass for cytosine is", C.MM))## [1] "The molar mass for cytosine is 111.102"On PubChem, the molar mass of thymine is 126.11g/mol, of guanine is 151.13 g/mol, and of cytosine is 111.1 g/mol, which all corroborate with the results above.
You can download the PDB files for thymine, cytosine, and guanine.
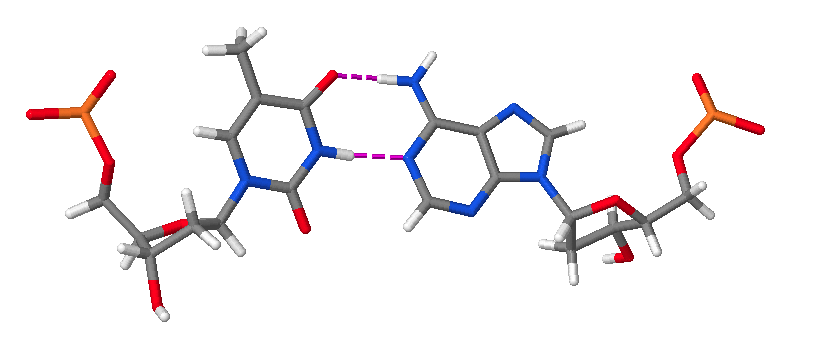
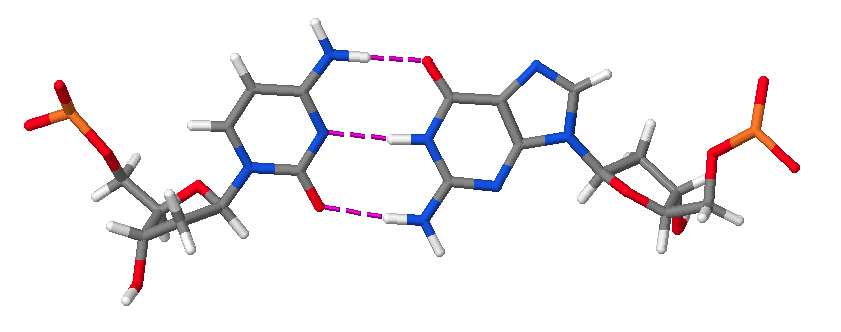
DNA Base Pairing
Hence, DNA may contain adenine (A), thymine (T), cytosine (C), and guanine (G) bases. In double stranded DNA there is complementarity between strands whereby A forms a linkage with T that consists of 2 hydrogen bonds, whereas G forms a linkage with C that consists of 3 hydrogen bonds. The AT and GC base pairing is illustrated in the following molecular structure images:
An AT base pair.
A GC base pair.
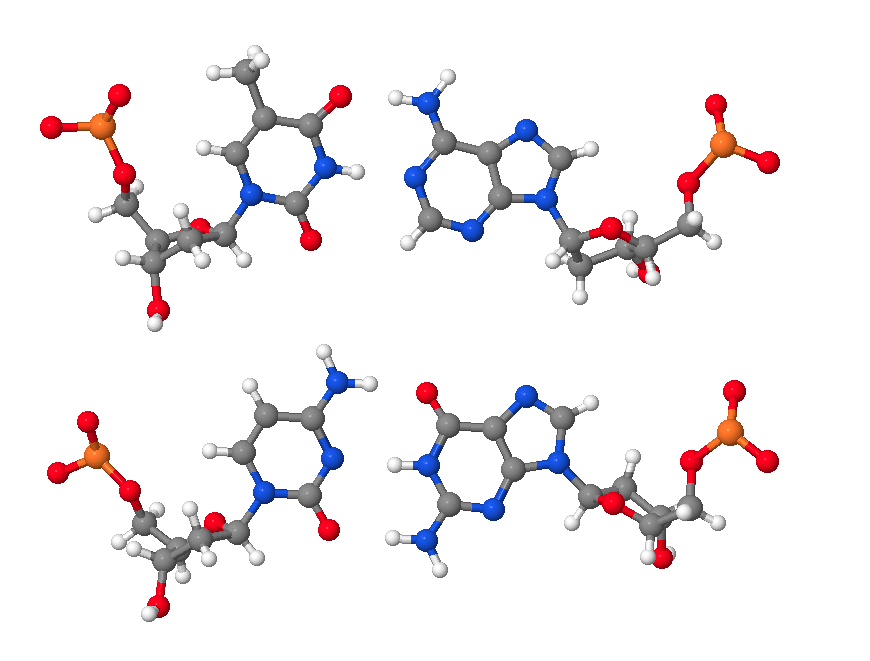
An AT and a GC base pair shown together.
These images of DNA base pairs were obtained online from MolviZ.Org on the DNA Structure page by Eric Martz and Angel Herráez, wherein their Nucleotide Pairing model is particularly useful for illustrating the basic principles of DNA molecular composition and geometry.
The Weight of an AT vs. a GC Base Pair
We can see from the images and calculations above that the 4 nitrogenous bases vary in molecular structure and in the number of atoms of each element that comprise them, and hence there are differences in the molar mass of each nitrogenous base.
Now let’s examine the molar mass of an AT and a GC base pair to determine whether they may have substantially different masses. Here I’ll use the PDB file for a GC base pair to extract the number of atoms of each element in the same manner as for calculating the molar mass of the nitrogenous bases.
# Read the CG base pair PDB file into a tibble. Skip the first 2 rows that
# do not contain the desired data.
CG <- read_table2(file = "../../static/files/c-g_b.pdb",
                       col_names = FALSE,
                       skip = 2)

# Only the rows with ATOM in column 1 are the ones that should be retained.
CG2 <- CG[grep("ATOM",CG$X1), ]

CG.atoms<- substr(as.data.frame(CG2)[,3], 1, 1)

# Make a table with the total number of atoms of each type.
CG.table <- table(CG.atoms)
CG.table
## CG.atoms
## C H N O P
## 19 24 8 12 2It looks like the GC base pair has the formula C19H24N8O12P2. Let’s determine the molecular mass of the GC base pair using the following code, which is similar to how we calculated the molecular mass of adenine above.
# Change to a data frame.
CG.df <- as.data.frame(CG.table)

# Add a 3rd column that is the atomic mass of each element.
CG.df2 <- cbind(CG.df, MW = PeriodicTable::mass(CG.df[1:nrow(CG.df),1]))

# Add a 4th column that is the total molecular weight of each element
# in the nucleotide base molecule. This is the product of the atomic
# mass and the number of atoms of each element.
CG.df3 <- cbind(CG.df2, MW.tot = CG.df2[,2] * CG.df2[,3])

CG.df3
## CG.atoms Freq MW MW.tot
## 1 C 19 12.01070 228.20330
## 2 H 24 1.00794 24.19056
## 3 N 8 14.00670 112.05360
## 4 O 12 15.99940 191.99280
## 5 P 2 30.97376 61.94752sum(CG.df3[,"MW.tot"])## [1] 618.3878And thus the molar mass of a GC base pair is 618.3878 g/mol.
Now let’s perform the same calculation of molecular mass for an AT base pair.
# Read the CG base pair PDB file into a tibble. Skip the first 2 rows that
# do not contain the desired data.
AT <- read_table2(file = "../../static/files/t-a.pdb",
                       col_names = FALSE,
                       skip = 2)

# Only the rows with ATOM in column 1 are the ones that should be retained.
AT2 <- AT[grep("ATOM",AT$X1), ]

AT.atoms<- substr(as.data.frame(AT2)[,3], 1, 1)

# Make a table with the total number of atoms of each type.
AT.table <- table(AT.atoms)
AT.table
## AT.atoms
## C H N O P
## 20 25 7 12 2This AT base pair has the formula C20H25N7O12P2.
Now let’s calculate the molecular weight of an AT base pair.
# Change to a data frame.
AT.df <- as.data.frame(AT.table)

# Add a 3rd column that is the atomic mass of each element.
AT.df2 <- cbind(AT.df, MW = PeriodicTable::mass(AT.df[1:nrow(AT.df),1]))

# Add a 4th column that is the total molecular weight of each element
# in the nucleotide base molecule. This is the product of the atomic
# mass and the number of atoms of each element.
AT.df3 <- cbind(AT.df2, MW.tot = AT.df2[,2] * AT.df2[,3])

AT.df3
## AT.atoms Freq MW MW.tot
## 1 C 20 12.01070 240.21400
## 2 H 25 1.00794 25.19850
## 3 N 7 14.00670 98.04690
## 4 O 12 15.99940 191.99280
## 5 P 2 30.97376 61.94752sum(AT.df3[,"MW.tot"])## [1] 617.3997Thus an AT base pair has a molar mass of 617.3997 vs. 618.3878 for a GC base pair. This is equivalent to a difference of 0.16%, or less than one fifth of one percent between the base pairs, a negligible amount.
A rule of thumb is that the average weight of a DNA base pair is 650 daltons. A dalton weighs 1.66054 x10⁻²⁴ g, and so 650 daltons weigh 1.079351 zg. According to this rule, the 4.64 Mb genome of E. coli K12 would weigh 4.64 x106 bp X 1.0794 x10-21 g/bp = 5.0081891 fg.
In my previous blogpost on prokaryotic genome size, I determined the median prokaryotic genome size was 4.050955 Mbp, whereas the smallest was 0.185014 Mbp and the largest was 16.0407 Mbp.
Let’s start with calculating the mass of the median genome:
\[4.050955 \times 10^{6} bp * \frac{650 Da}{bp} * \frac{1.66054 \times 10^{-24} g}{1 Da} * \frac{1\times10^{15}fg}{1 g} \]
= 4.3724023 fg weight of the median genome size.
Using the above formula, the largest genome weighs 17.3135456 fg while the smallest genome weighs 0.199695 fg.
Note that the 650 dalton rule of thumb is described as the mass of one DNA base pair as a sodium salt. However, the value that I obtained is for the mass of a DNA base pair is 618 daltons, a discrepancy of 32 daltons. A sodium atom weighs ~23 daltons, and so even then there are about 9 daltons that remain unaccounted, and the source of this discrepancy should be identified.
Also note that on the Thermo Fisher website for DNA and RNA Molecular Weights and Conversions, under the heading “Nucleic Acid Molecular Weight Conversions” and subheading “Approximate M.W.’s of Nucleic Acids”, the folowing approximation is listed, which also deviates from my result of 618 daltons for the weight of a DNA base pair:
M.W. of dsDNA = (# nucleotides x 607.4) + 157.9
Conclusion
The structure and composition of the 4 nitrogenous bases of DNA (A, T, G, and C) vary as does their molecular weight which ranges from 111.1 daltons for cytosine to 151.13 daltons for guanine. However, in double-stranded DNA, due to the formation of AT and GC base pairs, the difference in molecular weight of the individual bases is offset such that there is less than one fifth of one percent difference in the molecular weight of an AT base pair (617.3997 Da) vs. a GC base pair (618.3878 Da). Hence, differences in prokaryotic genome mass due to GC content variation would be negligible, and sequence length is the most influential factor determining the mass of prokaryotic genomes, which vary from 0.199695 fg for the smallest genome to 17.313546 fg for the largest, with a median mass of 4.372402 fg.
In the next blogpost, I will extrapolate from the mass of a single prokaryotic genome to the mass of prokaryotic community DNA to be expected from the typical amounts of sample material used in DNA extractions.
Additional Resources
A summary of useful DNA facts and figures is presented in IDT’s Molecular Facts and Figures pdf.